Gallery
Examples of figures drawn with ClimCanvas. For each plot mode, the figures show what each plot kind (layer) looks like. Click a thumbnail to open the full-size figure. For the settings behind each figure, see the Manual.
Horizontal map
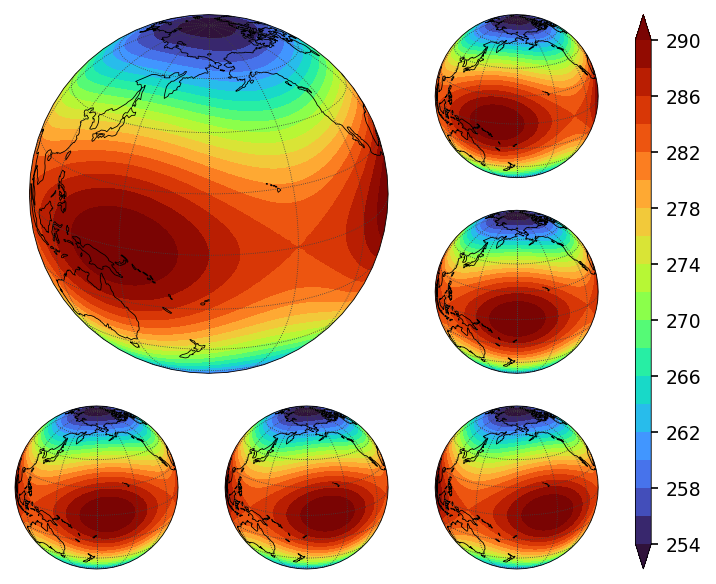
A map on a map projection. Fill, contours, hatch, vectors, streamlines, scatter (points) and track layers can be overlaid.
Coming soon.
Vertical cross-section
Latitude or longitude × vertical sections. Fill, contours, hatch, vectors and streamlines can be overlaid.
Coming soon.
Time section
Time × space sections (Hovmöller diagrams, time–height sections, etc.).
Coming soon.
1-D plot
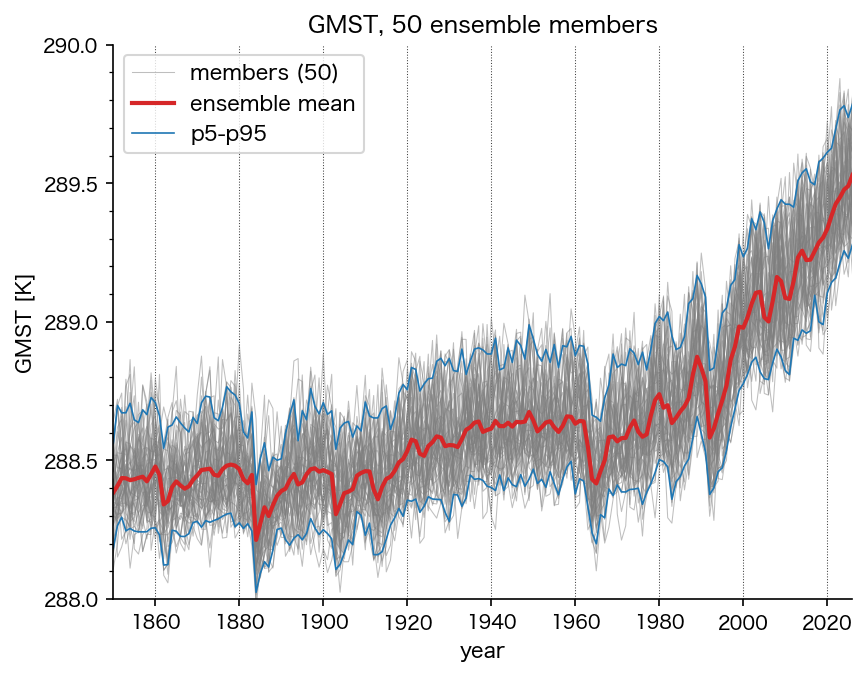
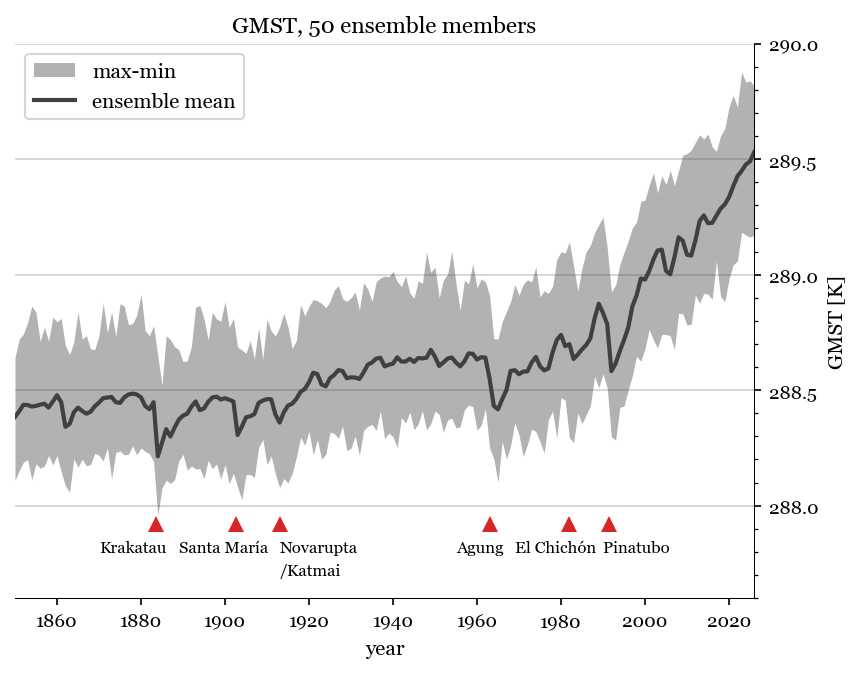
Lines, line bundles, bands (filled), stacked plots and bars. Series can be assigned to two vertical axes, left and right.
1-D plot (aggregation)
Histogram, ECDF, box plot, violin.
Coming soon.
2-D plot
Scatter and bubble plots; switchable to a categorical heatmap (matrix display of a 2-D variable).
Coming soon.
2-D plot (aggregation)
hist2d, hexbin.
Coming soon.
Whole figure (multiple panels, animation)
Multi-panel layouts (mosaic), shared colorbars, and animations stepping through time or rotating the globe.