Plot atmospheric and oceanic data.
ClimCanvas is a GUI visualization tool that builds basic plots of atmospheric and oceanic data in your browser from netCDF files. Figures can be exported not only as image and video files but also as Python scripts that reproduce them exactly.
Open source and free / available on GitHub (AGPL-3.0-only)
No analysis. Just visualization.
ClimCanvas handles only simple aggregation and averaging, plus visualization. Everything else is left in your hands, making the path from data to figure as short as possible.
Load netCDF files
Open a netCDF file and the dimensions and variables are recognized automatically. You can start plotting right away.
Build basic plots in the GUI
Assemble the basic plots used in atmospheric and oceanic research with GUI operations alone, without writing any code.
Instant preview of every change
GUI operations are reflected in the figure immediately, so fine-tuning a figure is easy.
Save figures and animations
Figures can be saved as PNG and other image formats, and figures stepped through time as GIF / MP4 animations.
Script Maker — reproduce the figure exactly
Automatically generates a Python script that reproduces the figure exactly. Move from the GUI straight to publication-quality code.
Locally or on a server
Works with the same UI in your own browser, whether the data are on your PC or on a lab server.
Figures that take effort in a script, drawn with ease.
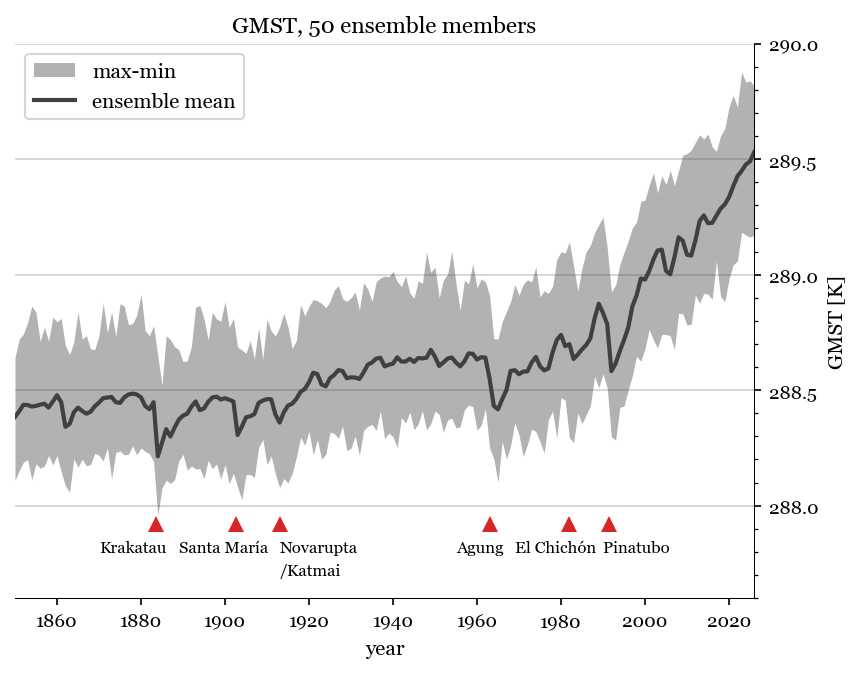
Figures that take many steps to write as a script — an ensemble bundle with summary lines overlaid, or an animation that rotates the globe while stepping through time — can be built with on-screen operations alone. The gallery has examples for each plot mode.
Install from GitHub
The source code is published in the GitHub repository (ClimCanvas/ClimCanvas). Cloning it always gives you the latest version. Detailed steps and how to get a specific version are on the Install page.
Go to the GitHub repositoryRequired libraries and optional packages →
Send us your feedback
Feature requests, questions about usage, and comments are welcome. No GitHub account is needed, and responses are not made public. Bug reports are also accepted via GitHub Issues (see the FAQ for which channel to use).