
FAQ
This page collects frequently asked questions and common stumbling points. The features are described in the manual; installation and operating procedures are in Usage.
- Display and operation
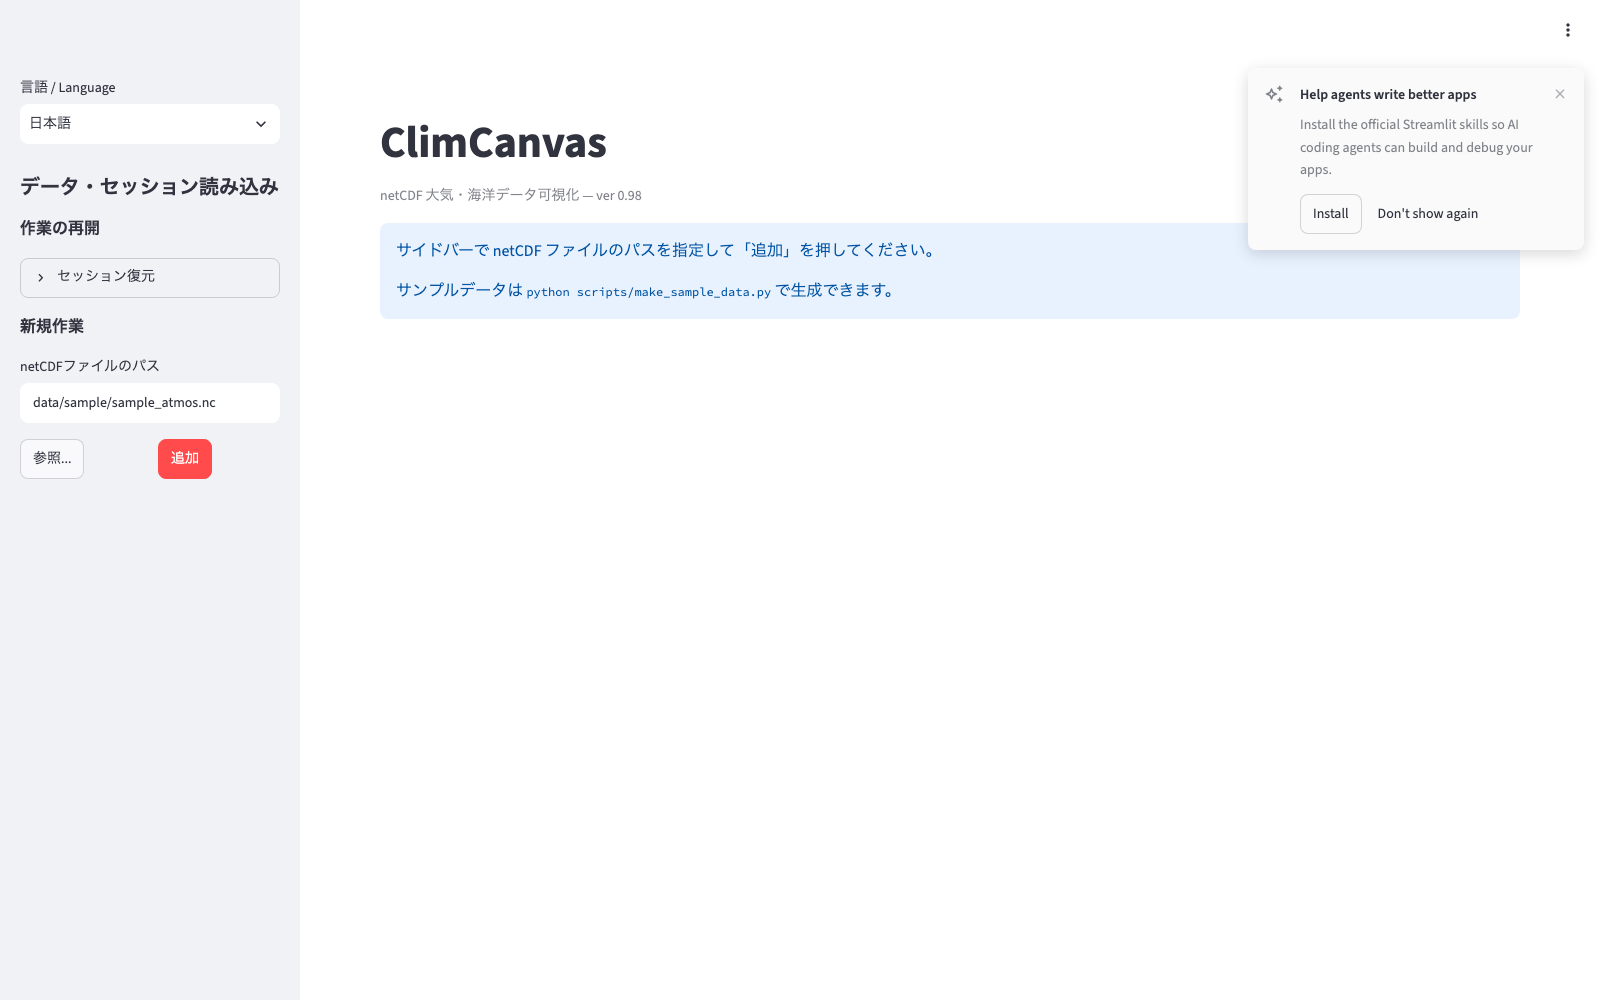
- A card "Help agents write better apps" appeared at the top right on startup
- The text on the screen changed by itself. Buttons stopped working
- The figure does not change after I changed a setting
- My settings disappeared after reloading the browser
- I want to change the display language, or start in English
- There is no "Browse..." button, or pressing it does nothing
- The plot mode options have no horizontal map (time section)
- I want to change the settings of another panel, or of all panels at once
- Every operation makes me wait
- I want to send requests or feedback, or report a bug
- Data
- Can I plot data with longitude from -180 to 180?
- There is a gap at longitude 0° (360°)
- Values that should be missing (such as -9999) are drawn
- A thin gap between the coastline and the fill. Data spill onto land
- Time is shown as numbers instead of dates
- I want to use the lag axis of a lag correlation for a time section or an animation
- Dimension names differ between files (lat and latitude, etc.)
- Longitude and latitude are in a separate file (ClimCORE, etc.)
- The range mean says "The mean cannot be computed"
- No time section for 2-D coordinate data, and the cross-section orientations differ
- Figure appearance
- Changing the figure size does not change the shape of the map
- Japanese characters appear as □ (tofu)
- Longitude/latitude labels come out coarser than the specified interval
- Too much vertical space between rows of maps in a multi-panel figure
- Contours stay above the fill even after reordering the layers
- I want white around 0
- Thin lines at the level boundaries after making the fill semi-transparent
- No latitude labels in the polar projection
- Too many vector arrows, or they are too small
- I want to place the legend outside the frame
- I want to change the hatch color
- I want to show the time above the figure, or change its format
- Output
- The size or aspect ratio of the saved image differs from the figure size
- I saved with a transparent background but it is white
- MP4 is not among the file formats
- The color range changes from frame to frame in an animation
- Generating an animation is slow, or the file is large
- The reproduction script does not run on another machine
- Relative paths in the reproduction script do not resolve
- Files are not found when restoring a session
- The language does not change when I load a session
- An old session cannot be restored
- I used it in a paper or a talk. How do I cite it?
- Meaning of error messages
Display and operation
A card "Help agents write better apps" appeared at the top right on startup
This is a feature of Streamlit 1.64 and later, not a ClimCanvas feature. It may appear once, the first time you start the app on a local PC that also has an AI coding agent (such as Claude Code) installed. It is a notice for developers offering to install helper files (skills) that teach AI agents how to write Streamlit apps; it is not needed just to use ClimCanvas. Press "Don't show again" and it never appears again. ClimCanvas also writes the same setting at startup, so normally it does not appear at all, or at most once. Pressing "Install" makes Streamlit write files for agents to your home directory and the like (this does not affect how ClimCanvas works).

The text on the screen changed by itself. Buttons stopped working
The browser's automatic translation (Chrome's "Translate this page") is active. Translation rewrites the page contents, so besides changing the display it can make the controls stop working. From the translate icon in the address bar, set localhost (or the server address in a remote setup) to "Never translate this site". To change the display language, use "言語 / Language" inside the app.
The figure does not change after I changed a setting
Numeric and text input fields are committed with Enter (or by clicking outside the field). If a committed change is still not reflected, press "🔄 Redraw figure" in the main area. Do not reload the browser: that clears all settings.
My settings disappeared after reloading the browser
The loaded files and settings exist only inside the app process, and reloading the browser, closing the tab, or quitting the app returns everything to the initial state. To continue the work later, save it with "Save" → "Session" and restore it with "Data & session loading" → "Resume work" (Saving).
I want to change the display language, or start in English
Switch with "言語 / Language" at the very top of the sidebar. The language is not saved in sessions; to start in the same language next time, press "Save" → "Preset" → "Save preset" (UI language).
There is no "Browse..." button, or pressing it does nothing
When allowed_dirs (a restriction on the directories that can be opened) is set in the configuration file, "Browse..." is not shown; instead you navigate folders with "📁 Choose from allowed directories". The "Browse..." dialog opens on the machine running the app, so it cannot be used in a remote setup where the app runs on a server and you use it from a browser. Enter the path directly, or use the allowed-directories setting (Loading files).
The plot mode options have no horizontal map (time section)
The coordinate roles (latitude, longitude, vertical, time) have not been recognized. Open "File info" → "Auto-detected coordinates (ds0)" in the main area and check which role is "(none)". Detection uses the standard_name, units and axis attributes and the names of the coordinate variables, so fixing the attributes or names in the file is the reliable way. Only time can be set from inside the app with "Dimension to treat as time" (Automatic detection of coordinate roles).
I want to change the settings of another panel, or of all panels at once
The sidebar shows only the settings of the panel chosen under "Panel layout" → "Panel to edit". To apply the same change to all panels, press "🔗 All panels shared" first and then operate (All panels shared).
Every operation makes me wait
Every single change of a setting redraws the figure from scratch. With heavy data, narrow the region and time first, then adjust the appearance. The moment you switch the value range to manual, and the time selector of files with tens of thousands of time steps, are also slow (Performance guide).
I want to send requests or feedback, or report a bug
Open the "⋮" menu at the top right of the app → "About". Opened from About, the form is pre-filled with the version you are using.
| What to send | Where |
|---|---|
| Impressions, requests, trouble with usage | Feedback form (Japanese). No GitHub account is needed, and responses are not made public |
| Bug reports and feature requests | GitHub Issues of the repository. Issues are public, so do not paste unpublished data or figures. The things we ask you to include (version, output of ncdump -h, session, etc.) can be filled in by following the form fields |
| Anything else | Email climcanvas@gmail.com |
We may not reply individually, and we cannot promise to adopt requests. The app never sends anything automatically (the links only open pages in your browser).
Data
Can I plot data with longitude from -180 to 180?
Yes. 0–360 and -180–180 give the same figure, and ranges can be specified in either convention (Cyclic longitude).
There is a gap at longitude 0° (360°)
On a 1-D, evenly spaced, ascending longitude grid that covers the full circle, a cyclic point that closes the seam is added automatically for fills, hatches and contours. A gap appears when the grid is unevenly spaced or descending, or when the coordinates are 2-D. No cyclic point is added for vectors, streamlines, scatter (points) or tracks.
Values that should be missing (such as -9999) are drawn
ClimCanvas does not detect missing values itself; it skips only the values that xarray turned into NaN from the netCDF _FillValue or missing_value attribute. valid_range and the like are ignored, and magic values without an attribute are drawn as they are. Add the attribute in the file, or convert them to NaN in preprocessing (Missing values).
A thin gap between the coastline and the fill. Data spill onto land
Fill (contourf) only fills up to the centers of valid grid points, so if the cells just offshore are missing, a strip remains along the coast. Any of the following makes it less visible: set "Drawing method" to pcolormesh, fill the ocean with a light color under "Map settings", or use higher-resolution data. When land cells also hold values and the data spill onto land, hide them with "Fill land" → "Draw above data" (Coastlines, borders and land).
Time is shown as numbers instead of dates
Fixed-length calendars such as the 360-day calendar, or years that cannot be represented as datetimes (dummy times in year 0000, paleoclimate data), are read as a numeric axis of running or elapsed days. Time selection and animation still work, but the date format cannot be set (Time axis and calendars).
I want to use the lag axis of a lag correlation for a time section or an animation
Choose that dimension under "File info" → "Dimension to treat as time", and it is treated as the time role (Dimension to treat as time).
Dimension names differ between files (lat and latitude, etc.)
They are automatically aligned to the names in the first file, so you can use them as they are. Only the names are aligned; overlaying files whose coordinate values do not match on the same axis gives an error at drawing time (Multiple files).
Longitude and latitude are in a separate file (ClimCORE, etc.)
Under "Coordinate file (optional)" below each file in "Loaded files", specify the longitude and latitude files and press "Apply". A Lambert grid is recognized automatically (Coordinate files).
The range mean says "The mean cannot be computed"
Either the longitude range crosses the dateline but the data do not cover the globe, or the range extends beyond the longitude range of the data. Keep the range within the data. Setting min greater than max specifies a range that crosses the dateline (330 → 30 means 30W to 30E) (Fixing dimensions).
No time section for 2-D coordinate data, and the cross-section orientations differ
On a grid with 2-D latitude/longitude, the time section (sections with latitude or longitude as an axis), range means over latitude/longitude, and the cyclic longitude point are not available (2-D coordinates). Vertical cross-sections are available, but the orientation is chosen from "along a grid row / column" (no interpolation) and "along a parallel / meridian / great circle" (interpolated) (vertical cross-section, interpolation of sections along a path).
Figure appearance
Changing the figure size does not change the shape of the map
The aspect ratio of a map is determined by the projection and the displayed extent; the figure size affects only the surrounding margins. Choose the aspect ratio of the figure size to match the map (for a global equirectangular map, around 10 inches wide by 5.5 inches high). "Plot size" is not available for horizontal maps (Figure size and aspect ratio, Map aspect ratio).
Japanese characters appear as □ (tofu)
Choose a Japanese font (Hiragino Sans on macOS, Noto Sans CJK JP on Linux, etc.) under "Figure-wide format" → "Font" → "Set font". A warning appears before drawing when the figure contains Japanese but the font does not support it. The same font is also needed when the reproduction script is run on another machine (Fonts).
Longitude/latitude labels come out coarser than the specified interval
When labels would overlap, cartopy thins them automatically (for example, only every other label appears at a 20° interval). Any of the following shows them all: set "Longitude label rotation (deg)" to around 45°, reduce "Label font size", or widen the figure (Gridlines and labels).
Too much vertical space between rows of maps in a multi-panel figure
Because the aspect ratio of a map is fixed, blank space remains above and below the assigned cell. Either set "Vertical (hspace)" under "Figure-wide format" → "Layout adjustment (margins)" to a negative value to close the gap, or match the aspect ratio of the figure size to the maps (for a 2×2 of global maps, width:height = 2:1 as a guide). Closing it too much makes titles and labels overlap, so adjust while watching the figure (Layout adjustment).
Contours stay above the fill even after reordering the layers
In maps and sections, the stacking is determined by the default heights of matplotlib (and cartopy for maps), and the layer order only matters between elements at the same height (fill vs. fill, lines vs. lines). Contours, streamlines and tracks are always above fills, hatches and vectors. Fills, hatches and vectors stack in layer order, so if vectors are hidden by a fill, put the vectors after the fill (a lower row) (Stacking order).
I want white around 0
Turn on "White near zero" in the fill layer. The color band containing 0 (the two adjacent bands if 0 is a boundary) becomes white (White near zero).
Thin lines at the level boundaries after making the fill semi-transparent
This is a property of matplotlib when contourf is drawn with transparency below 1. It does not occur if you set "Drawing method" to pcolormesh (Fill).
No latitude labels in the polar projection
On a full-circle map covering all longitudes, the parallels never cross the frame, so "Along the frame" under "Latitude labels" shows nothing. Choose "Inside the map", or restrict the longitude range to make a sector map (Projection and extent).
Too many vector arrows, or they are too small
Increase "Grid cells to skip" to reduce the number of arrows. For the length, uncheck "Automatic scale" and set "Reference vector length (% of axes width)" to the percentage of the plot width at which the reference vector is drawn. Weak-wind areas can be omitted with "Hide arrows at or below a magnitude threshold (maskout)" (Vectors).
I want to place the legend outside the frame
Turn on "Legend" → "Set position by coordinates (outside the frame allowed)" and specify, for example, x = 1.02, y = 0 (outside right) or x = 0, y = -0.25 (outside bottom). A legend outside the frame is not cut off when saving (Legend).
I want to change the hatch color
The line color of a hatch layer cannot be set (it is black). The hatch of a bar chart has "Hatch color".
I want to show the time above the figure, or change its format
Turn on "Time" → "Show time" → "Show the time above the plot" and choose "Position" and "Time format" (year, year-month, custom strftime, etc.). In animations it follows each frame (Fixing dimensions).
Output
The size or aspect ratio of the saved image differs from the figure size
The pixel count of the image is the figure size (inches) × "Resolution (dpi)". When "Trim margins" is on, the surrounding margins are cut off, so the aspect ratio approaches that of the plot area (Saving still images).
I saved with a transparent background but it is white
JPG and EPS do not support transparent backgrounds. Use PNG, TIFF, SVG or PDF. The background setting is not reflected in the preview; it affects only the saved image.
MP4 is not among the file formats
MP4 output requires ffmpeg, and the option appears only when ffmpeg is found on the PATH. See Installation for how to install it. GIF does not need it.
The color range changes from frame to frame in an animation
With "Automatic value range" left on, the minimum and maximum are determined for each frame. Using "Value ranges within the time span" shown under "Animation" as a guide, fix the minimum and maximum of the fill by hand (Time-stepping animation).
Generating an animation is slow, or the file is large
The whole figure is redrawn for each frame, so the time is proportional to the number of frames. Any of the following makes it lighter: thin the frames with "Step (every n)", lower "Resolution (dpi)", or reduce "Total frames" for the rotating globe. MP4 is smaller than GIF.
The reproduction script does not run on another machine
You need xarray (and a backend such as netCDF4), numpy, matplotlib and cartopy. Figures that use external colormaps (cmocean, etc.) also need that package. Fonts are environment-dependent; if the font is missing, matplotlib falls back to its default. The 1:50m / 1:10m geographic data are downloaded by cartopy on first use (Reproduction script).
Relative paths in the reproduction script do not resolve
Relative paths under "netCDF path style" are relative to the directory from which the app was started. Run the script in the same directory, or change the paths to absolute paths. Animation reproduction scripts always use absolute paths.
Files are not found when restoring a session
The session JSON holds only the paths of the netCDF files, not the data themselves. If the original files are moved or deleted, restoring fails. Put the files back in their original location, or load them again as new work (Session).
The language does not change when I load a session
By design, the display language is not included in sessions. The language is saved in the preset (UI language).
An old session cannot be restored
Sessions saved by versions before multi-panel support cannot be restored. The later format that saved options by their display names (Japanese) is converted automatically on loading. Settings that changed between versions are ignored (no error is raised).
I used it in a paper or a talk. How do I cite it?
Cite it stating the version you used. The version can be found under About in the menu at the top right of the app, or in the first line of the reproduction script. The DOIs (how to use the concept DOI and the version DOIs) and citation examples are summarized in Installation 4.4 Citation.
Meaning of error messages
| Message (beginning) | Cause and remedy |
|---|---|
| No drawable combination of coordinates found | The coordinate roles satisfy the conditions of no mode. Check the roles under "File info" and fix the attributes or names (mode-missing) |
| No variable with latitude/longitude found | No variable can be drawn as a horizontal map. A variable with both latitude and longitude dimensions, or point data with longitude/latitude coordinates, is required |
| No dim has coordinates | No dimension with coordinates can serve as the horizontal axis of a 1-D plot |
| All values are missing (NaN); color levels cannot be determined automatically | All values at the chosen time, level and region are NaN. Choose another time or region, or specify the levels by hand |
| The values are constant (min = max …); … cannot be determined automatically | A constant field. Specify the levels directly, or set the value range |
| The longitude range … crosses the dateline, but / … extends beyond the data longitudes | The longitude range of the range mean is not within the data (avg-lon-error) |
| The 2-D longitude/latitude coordinates … contain … non-finite values (NaN / inf) | The 2-D coordinates themselves contain NaN (such as land points of an ocean model). Exclude those grid points by restricting the region, or fill the coordinates on the data side |
| The region … contains no grid points of this curvilinear grid | The region is outside the grid. Check the coordinate ranges under "File info" |
| Cannot place {n} panels in a {rows}×{cols} grid | Increase the rows/columns or delete panels |
| Invalid mosaic; falling back to row-major placement | The mosaic syntax is wrong (uneven row lengths, number of labels not matching the number of panels, non-rectangular). Check the mosaic notation |
| No time dimension found; cannot animate | There is no time role. Set it with "Dimension to treat as time" |
| ffmpeg not found | MP4 output needs ffmpeg (mp4) |
| Cannot draw the scatter: variable … still has unfixed dimension(s) … | Fix the remaining dimensions of the point data (time, etc.) with "Fix: {dimension}" |
| Cannot draw vectors: the x component … and the y component … are on different grids | Both components must be on a grid with the same dimension names and shape |
| Mask variable … has dimension(s) … that the drawn variable does not have / lacks the drawing dimension(s) | The dimensions of the variable chosen for "Mask by another variable" do not match the drawn variable. Choose a variable with the same dimensions as the drawn variable |
| Color levels … must be two or more ascending, non-duplicated values | Review the values under "Levels (comma-separated)" |