
Multiple panels
This chapter describes how to arrange several panels (matplotlib axes) in one figure. Each panel can have its own plot mode, so a map and a time series can share one figure. For the size and margins of the whole figure see Basics.
Panel layout and the editing flow
Open "Panel layout" in the main area to see the figure grid and the list of panels.
| Item | Description |
|---|---|
| Rows / Columns | Grid size (1 to 8 each, default 1×1). Panels fill the grid row by row from the top left |
| Panel list | One row per panel ("number: plot mode"). "←" and "→" move the panel earlier or later in the order, the duplicate icon appends a new panel with a copy of the settings, and the delete icon removes the panel (only when there are two or more panels) |
| Add panel | Appends an empty panel |
| Panel to edit | Buttons arranged like the grid. The settings of the pressed panel appear in the sidebar (red = being edited) |
| 🔗 All panels shared | Toggles the shared editing mode ("All panels shared" editing) |
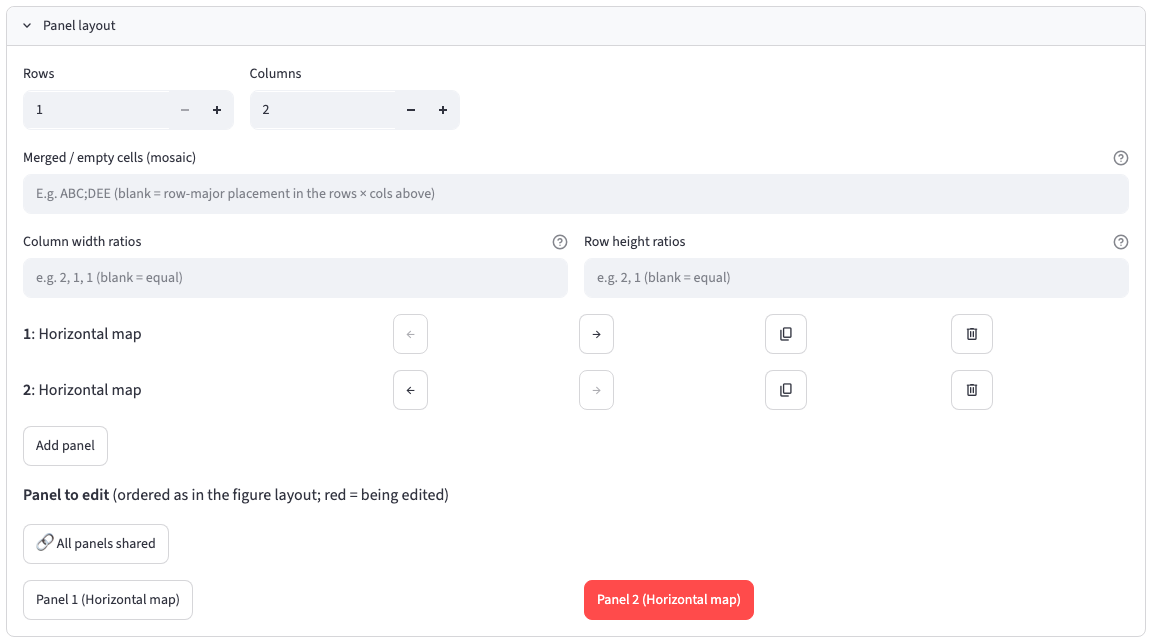
Only the settings of the panel being edited appear in the sidebar. The plot mode of a panel is chosen under "Plot mode (per panel)" → "Plot mode" in the sidebar, and each panel can use a different mode. A panel you add or duplicate automatically becomes the one being edited.
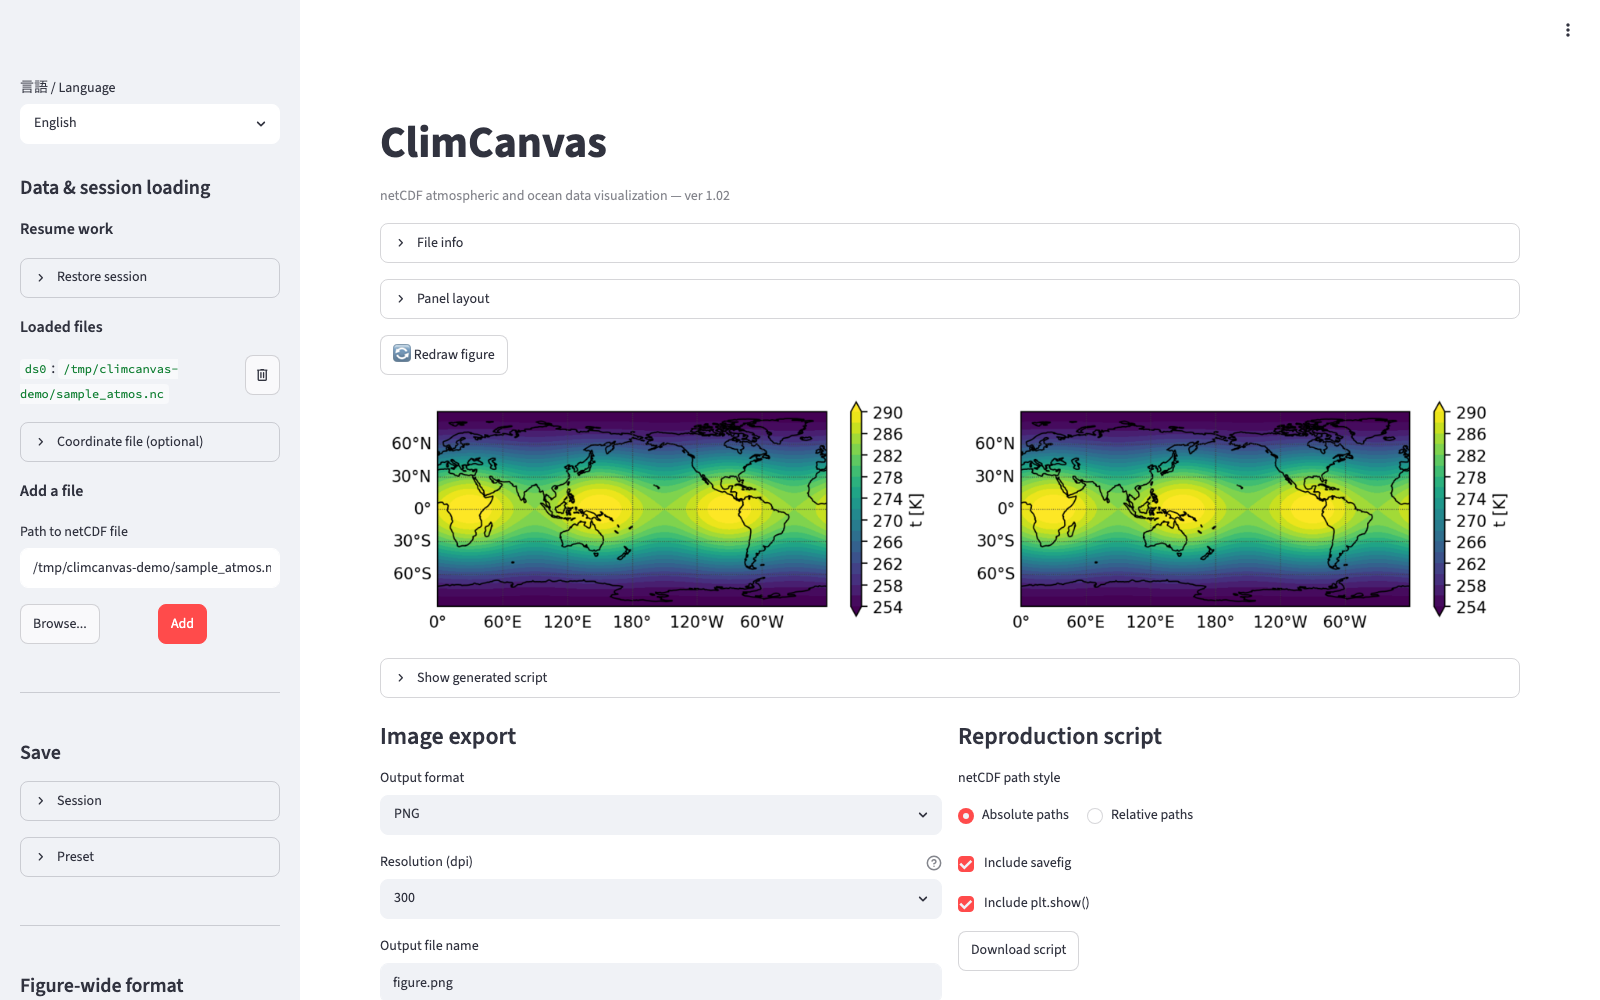
There is one "Figure size" for the whole figure, and each panel is sized to fit its grid cell. The aspect ratio of each panel's plot area is set with "Plot size" (Figure size and aspect ratio).
Recommended workflow
The quickest way is to finish one panel, duplicate it, align the appearance with "All panels shared" editing, and finally select the panels one by one to change the variable or time.
- When there are more panels than grid cells, the message "Cannot place {n} panels in a {nr}×{nc} grid" appears and nothing is drawn until you increase the rows and columns or delete panels.
- A panel that has never been configured is excluded from the figure and a warning is shown. Select it under "Panel to edit" and configure it.
Row and column ratios
Enter positive numbers separated by commas in "Column width ratios" and "Row height ratios" (e.g. 2, 1, 1). Blank means equal.
- The count must match the number of columns or rows. If it does not match or cannot be parsed, an error is shown and the figure is drawn with equal ratios.
- Ratios apply to whole rows and columns. A single cell cannot be enlarged on its own, but combined with merged cells a merged panel takes the total size of the rows and columns it spans.
- They work independently of the gaps between panels ("Figure-wide format" → "Layout adjustment (margins)").
Merged and empty cells (mosaic)
When a string is entered in "Merged / empty cells (mosaic)", it determines the grid in preference to the rows and columns inputs.
- Separate rows with
;(or a newline); one character is one cell. Whitespace is ignored. - The same character arranged in a rectangle merges those cells into one panel. Arrangements that are not rectangular (L shapes, the same character in separate places) are errors.
.is an empty cell.- The order of first appearance (row by row from the top left) maps the characters to panels 1, 2, 3, … in the panel list. Alphabetical order is not used.
- The number of distinct characters must match the number of panels.
| Example | Meaning |
|---|---|
ABC;DEE |
2 rows × 3 columns with 5 panels. Columns 2 and 3 of the bottom row are merged |
AAB;C.B |
The left two cells of the top row are merged, the right column spans both rows, and the bottom middle cell is empty |
AAB;AAC |
The left 2×2 block is merged into one panel |
If the mosaic is invalid, the message "Invalid mosaic; falling back to row-major placement" appears and the panels are placed row by row according to the rows and columns inputs. The "Panel to edit" buttons follow the same arrangement as the mosaic (a merged cell is represented by its top-left cell; empty cells have no button).
Panel labels
The (a), (b) labels used in multi-panel figures in papers are set per panel under "Text & markers" → "Panel label" in the sidebar.
| Item | Default |
|---|---|
| Show panel label | Off |
| Label text | (a) |
| x, y (axes coordinates) | 0, 1.02 (outside the top-left corner of the plot frame) |
| Font size / Bold / Label color | 12 / On / black |
The text is typed by hand for each panel. Panel labels are excluded from "All panels shared" editing, so each panel keeps its own text even in shared editing mode.
"All panels shared" editing
Pressing "🔗 All panels shared" under "Panel layout" switches to shared editing mode, which shows the panel edited last as the representative in the sidebar. Settings changed in this mode are applied to all panels. Press the button again, or any of the "Panel to edit" buttons, to leave the mode.
- Only the changes made while shared editing is on are applied. Differences between panels that existed before remain.
- Titles, text, markers and panel labels stay per panel.
- Changing the plot mode of the representative panel switches every panel to that mode and copies the settings of that mode from the representative. Titles, text, markers and panel labels are not copied; each panel uses its own settings of that mode (empty for a mode used for the first time). These are stored separately per plot mode, so switching back to the original mode restores the original titles and labels. This is the same behavior as changing the mode of a single panel.
- Adding, deleting and changing the kind of a layer is applied to the panels with the same plot mode. Per-layer settings that were carried over (such as the chosen variable) are kept.
- Panels with a different plot mode receive only the settings they have in common (such as the time label or the plot size).
Panels created by duplication can be kept in exactly the same appearance with shared editing.
Animation and multiple panels
- Time-stepping animation advances the time of all panels in sync. The settings (start, end, step, etc.) are made under "Time" → "Animation" of the panel being edited.
- Panels whose plot axis is time (time sections, 1-D plots with time on the x-axis) do not fix the time and are drawn as they are.
- The time label of panels with "Show time" on follows each frame.
- Globe rotation (Orthographic projection) is available only with a single panel. With multiple panels only time stepping is available. See Output and reproduction scripts for details.
Compatibility notes
- Multiple panels form one Figure, so both the image and the reproduction script contain all panels in one file.
- Sessions saved by versions before multi-panel support cannot be restored.
- Sessions saved by older versions that stored options by their display name (Japanese) are converted automatically when loaded.