
Data handling
This chapter explains which coordinates ClimCanvas treats as latitude, longitude, vertical and time after a netCDF file is loaded, which dimensions are fixed, and which range is plotted. For the file-loading operation itself, see Basic operation. The numerical conventions for selection, cropping, averaging and missing values are listed in Computational conventions.
Coordinates and dimensions
In netCDF, a "dimension" and a "coordinate variable" are different things. ClimCanvas treats xarray's coordinate variables as coordinates and its dimensions as dimensions; the usual form is that the two correspond under the same name. Coordinate values are taken as they are in the array, so they need not be evenly spaced.
Dimensions without a coordinate variable (bare dims) are shown in "File info" as "Dims without coordinate variables (bare dims)" and are handled as follows.
- They cannot be used as the x-axis of a 1-D plot. Data without any dimension that has coordinates cannot be drawn as a 1-D plot.
- They are not candidates for fixing in horizontal maps and sections.
- In the heatmap and aggregation layers they are fixed by entering an index (from 0) in "Fix: {dim} (index)". When used as a heatmap axis, the ticks are the indices.
- A scatter plot uses a dimension with coordinates shared by the x and y variables as "Dim to draw along", so it cannot be drawn without a shared coordinate dimension.
When several files are loaded, the dimension names of the first file (ds0) are taken as the reference, and dimensions with the same role in the other files (for example latitude and lat) are renamed to match. Only the names are aligned; the coordinate values are not compared.
Auto-detection of coordinate roles
On loading, each coordinate variable is tested for the roles latitude (lat) / longitude (lon) / vertical (vertical) / time (time). The test is applied to each coordinate variable in the order time → latitude → longitude → vertical, and a role is adopted as soon as any one of its conditions holds. When several coordinates match the same role, only the first one found is used.
| Role | Condition (any of) |
|---|---|
| Time | The values are datetime (datetime64), standard_name is time, axis is T, the name is time / times / date / year |
| Latitude | standard_name is latitude, units is of the degrees_north kind, axis is Y, the name is lat / latitude / ylat / nav_lat |
| Longitude | standard_name is longitude, units is of the degrees_east kind, axis is X, the name is lon / longitude / xlon / nav_lon |
| Vertical | axis is Z, a positive attribute exists, the name is lev / level / plev / pres / pressure / height / altitude / depth / isobaric etc., or units is hPa / Pa / mb / m / km and the name is not a latitude or longitude |
Names and attributes are compared case-insensitively. The result appears under "Auto-detected coordinates (ds0)" in "File info". A role that could not be detected becomes "(none)", and the plot modes that use that role disappear from the choices.
| Plot mode | Condition for appearing |
|---|---|
| Horizontal map | The latitude and longitude roles exist (or track data with longitude and latitude variables) |
| Vertical cross-section | The vertical role and either the latitude or the longitude role exist (on a 2-D coordinate grid: sections along grid rows / columns, parallels, meridians and great circles) |
| Time section | The time role and one of the vertical, latitude or longitude roles exist. Not available on a 2-D coordinate grid |
| 1-D plot | At least one dimension has a coordinate variable |
| 1-D plot (aggregation), 2-D plot (aggregation) | A numeric variable without latitude or longitude among its dimensions exists (station data, etc.) |
| 2-D plot | At least one data variable exists |
When no mode can be offered, the app stops with "No drawable combination of coordinates found." Most failures to assign a role are due to variable names and attributes. The reliable fix is to correct the coordinate names or units in the file; only time can be specified inside the app, as described in the next section.
Dimension to treat as time
"Dimension to treat as time" in "File info" lets you give the time role to a numeric dimension that is not detected as time automatically (such as the lag axis of a lag correlation). The choices are the 1-D dimensions with coordinate variables in the first file; the default is "(follow auto-detection)".
- Once set, that dimension takes the time role in all files, and time stepping, animation and time sections become available along it.
- The setting is a marker in memory and is not written to the file. It is saved in the session.
- Because the time axis is numeric, the date format (strftime) option does not appear.
- A coordinate whose
unitsexpress a time difference, such as days, is read as numbers without conversion to datetime.
2-D coordinates (curvilinear grid)
Data whose latitude and longitude are both 2-D (for example lat(y, x), lon(y, x)) with the same two dimensions are treated as a 2-D coordinate grid. The Lambert grids of regional models and the grids of ocean models fall into this category. When the longitude and latitude are in separate files, attach them with coordinate files.
- The longitude and latitude variables in a coordinate file are found automatically from
unitsor the name; after checking that the dimension lengths match those of the main file, they are matched by position (it does not matter whether grid numbering starts at 0 or 1). - The central longitude and standard parallels of a Lambert conformal conic (or polar stereographic) projection are estimated from the longitude and latitude; if they fit, they become the initial values under "Projection & region". When recognized, the message "Grid projection detected: …" is shown.
-
When no region is specified, the rectangle containing all grid points (with no margins) is shown. To restrict by longitude and latitude, tick "Set lat/lon extent". The data are cropped to the bounding box of the grid points within the range.
-
Vertical cross-sections can be drawn along grid rows / columns and, by interpolation, along parallels, meridians and the great circle between two points (Vertical cross-section; the interpolation is explained in Interpolation of sections along a path).
What is not available on a 2-D coordinate grid
Time sections (sections with latitude or longitude as an axis), range means over latitude or longitude, and adding a cyclic point in longitude are not available. Vector components are taken as eastward and northward (they are not rotated into grid-aligned components). An error occurs when grid cells whose longitude or latitude is NaN (land cells of ocean models, etc.) fall inside the plotted region.
Fixing dimensions
The dimensions other than the two (or one) being plotted are either fixed at a single value or averaged over a range. Fixing happens at two levels: the panel and the layer.
| Level | Target | Where |
|---|---|---|
| Panel | Time (shared by all layers; stepped by animation) | The "Time" section of the sidebar |
| Layer | Vertical level, latitude, longitude and other dimensions that may differ from layer to layer | Inside each layer's settings |
When the same dimension is specified at both levels, the layer level takes precedence. The assignment per mode is as follows.
| Plot mode | Panel level | Layer level |
|---|---|---|
| Horizontal map | Time | Vertical level and other dimensions outside the horizontal plane |
| Vertical cross-section | Time | The latitude or longitude to fix |
| Time section | None | All dimensions not used by the section (latitude and longitude may also be range-averaged) |
| 1-D plot | Time (when the x-axis is not time) | All dimensions other than the x-axis |
| 2-D plot, aggregation modes | None | Everything at the layer level (including time) |
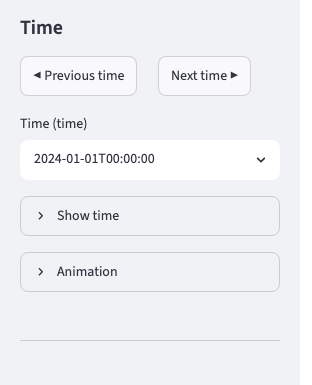
Contents of the "Time" section.
- Select the time with "◀ Previous time", "Next time ▶" and "Time ({dim})". The default is the first time. Datetimes are shown in the form
2024-01-01T00:00:00. - "Show time" → "Show the time above the plot" writes the selected time above the figure. "Position" is Left / Center / Right, and "Time format" is chosen from Auto / Year / Year-month / Year-month-day / Month/day / Hour:minute / Custom...; for Custom, write a strftime format (
%Yyear,%mmonth,%dday,%Hhour,%Mminute). The format option appears only for datetime coordinates. - Dimensions other than time are selected in the "{dim} [{units}]" select boxes. The initial values are the lowest level for the vertical (the maximum for pressure, the minimum for height), the grid point nearest 0° for latitude and the one nearest 180° for longitude.
For fixing at the layer level, in sections and similar plots you can choose "Fixed value" or "Range mean" per dimension.
- The range mean is the same as xarray's
mean: NaN is excluded (if 2 of 10 points in the range are NaN, it is the mean of the remaining 8). - The longitude range is entered as numbers in "min" and "max". Values outside the data convention such as -30 or 330 are also accepted, and when min is greater than max the range is taken to cross the dateline (330 → 30 means 30W to 30E). Dimensions other than longitude use a slider to select the range.
- Latitude has "cos(lat)-weighted", which weights the mean by the area element.
- Vertical levels and string coordinates allow fixed values only.
In scatter plots and bubble charts, the dimensions other than the one being drawn are fixed in each layer (the initial value is the middle index). In aggregation layers you choose "Dim to aggregate", and "Set aggregation range" narrows the period or interval.
Specifying ranges
Horizontal map
Ticking "Projection & region" → "Set lat/lon extent" sets the displayed range with "Longitude min", "Longitude max", "Latitude min" and "Latitude max".
- It is enabled by default for regional (non-global) data and for the Lambert projection, and disabled by default for global data. For the polar stereographic projection it is always enabled. The initial values are the data range for regional data, latitude 0 to 90 (-90 to 0 for the south) for the polar stereographic projection of global data, and latitude 0 to 65, longitude 100 to 180 for Lambert.
- The displayed extent follows the setting exactly, but the data are cropped one grid cell wider on each side so that the shading is not cut at the boundary. The automatic color range is based on this wider crop. Layer range means are computed over the exact range.
- Longitude can be given in 0 to 360 or in -180 to 180, and ranges crossing the dateline (for example 60 to 200) are also accepted. A width of 360° or more means all longitudes.
- In the Orthographic projection the displayed extent is not restricted (only the data are cropped).
Vertical cross-section and time section
- For a vertical cross-section, select the range with the "Height / pressure level range" and "Longitude range" (or "Latitude range") sliders under "Cross-section".
- For a time section, select the period with "Time range" under "Time section type". Time × latitude and time × longitude plots follow the Hovmöller convention and put time on the vertical axis (pointing downward).
1-D plot
Choose the x-axis dimension with "Axes" under "Plot axis", and set the range with the "Range" slider and input fields. The slider and the input fields are linked.
- The input fields of a time axis take ISO format (
2024-01-01or2024-01-01T12:00) and round to the nearest time. - The values in the input fields of a numeric axis are used as the range as they are, without rounding to grid points.
- When several files are loaded, the range can be chosen from the union of the coordinates of all files (for overlaying another file that continues the period).
- String coordinates have no range setting.
Even when a coordinate is descending (pressure 1000 → 200, latitude 90 → -90, etc.), the range is handled in the order of smaller and larger value. The direction is determined automatically from the coordinate.
Cyclic longitude
- In horizontal maps, a 1-D longitude grid covering the full circle (for example a 2.5° grid from 0 to 357.5) is detected automatically, and a cyclic point is added to close the seam between 0° and 360°. This applies to fill, hatch and contours. It is not added for vectors, streamlines, scatter (points) or tracks.
- Full-circle data are not cropped in longitude even when a region is specified, so any longitude range is drawn without a seam or gap.
- Either longitude convention (0 to 360 or -180 to 180) gives the same figure. The longitude range of a range mean is normalized to the data convention.
- On a 2-D coordinate grid, longitudes that jump across 180° between neighboring columns, such as 179 → -179, are made continuous before plotting.
- When the x-axis of a section is longitude, "Axes & labels" → "Axes" → "Show x-axis (longitude) as °E / °W" labels it as 120°E … 180° … 120°W centered at 180°.
- When the x-axis of a 1-D plot is longitude, "Plot axis" → "Unwrap x-axis cyclically (display beyond 360°)" repeats the data with a period of 360° and lets you specify a range beyond the data range (the default is from the data minimum to the data maximum + 360).
Missing values
ClimCanvas does not detect missing values itself. The values that xarray turned into NaN according to the netCDF attributes are passed to matplotlib as they are, and matplotlib skips them.
| Declaration in the file | Result |
|---|---|
_FillValue or missing_value present |
Becomes NaN and is not drawn |
Only valid_range / valid_min / valid_max |
Drawn as the value is (including values outside the range) |
| Nothing | Drawn as the value is |
- An integer variable with
_FillValuebecomes floating point on loading, and NaN is inserted. - In a file that marks missing values with -9999 or 1e20 without an attribute, those values are drawn as they are. Add the attribute in the file or convert them to NaN in preprocessing.
- Fill (contourf) shades only up to the centers of valid grid points. In data whose values are missing just off the coast, a thin band in the background color may remain between the data and the coastline. Conversely, in data that also have values in land cells, the data spill over the land. The latter can be hidden with "Map & gridlines" → "Fill land" → "Draw above data" (Plot modes).
- When all values of a variable are NaN, the error "All values are missing (NaN); color levels cannot be determined automatically" appears; when the values are constant, the error is that evenly spaced levels cannot be determined. Specify the levels or the value range manually.
- Range means are computed excluding NaN. Scatter, bubble chart, scatter (points) and track drop points whose x or y is NaN.
Time axis and calendars
Time coordinates are handled as follows on loading. The calendar is determined by the file's calendar attribute.
| Calendar | Handling |
|---|---|
| standard / gregorian / proleptic_gregorian / noleap (365_day) | Converted to datetime (datetime64). The date format option is available |
| 360_day / all_leap (366_day) | Turned into a numeric axis of consecutive days from the starting year (unit: day) |
| Years of the above that cannot be represented as datetime (dummy times in year 0000, paleoclimate data) | Turned into a numeric axis of days elapsed from the first time |
- Even with a numeric axis, time selection, stepping, animation and time sections work as usual. The date format (strftime) and ISO-format input are available only for datetime axes.
- Calendars not in the table above are not converted.
- The same conversion is written into the reproduction script, so the script's figure matches the app.
- A coordinate whose
unitsexpress a time difference, such as days (a lag axis, etc.), is read as numbers without conversion to datetime. - When a time section puts time on the vertical axis, inverting the vertical axis is enabled by default.